
Inpulse research report
State of Employee Emotions 2026–27
The new foundations of employee engagement.
September 2026

Executive summary
At first glance, the story of engagement in 2026 looks remarkably stable. But look at the emotions driving those scores and a different story emerges.
Today’s HR, People and Engagement leaders are doing the ultimate juggle. There’s continued economic uncertainty, rapid, relentless transformation, evolving employee expectations and growing pressure on managers. Yet engagement appears remarkably resilient, with headline scores showing a single percentage point increase between 2023 and 2026.
Inpulse data reveals a more nuanced picture. Engagement scores may be holding steady, but the factors underpinning long-term engagement have weakened.
Employees across eight key sectors report lower confidence in leadership, poorer perceptions of reward and recognition. Teams are also having more frequent conversations around change, workload and wellbeing; it’s clear employees want to communicate their concerns.
One theme stands out above all – engagement is becoming increasingly local. The strongest links to engagement are found in the quality of everyday experiences: support, recognition, trust, feedback and communication. But the managers responsible for shaping those experiences are facing mounting pressure themselves.
Behind the report: Data and methodology
This report and its findings are based on proprietary Inpulse data, collected between 1st January 2023 to 31st July 2026.
Here’s a snapshot of what that data encapsulates:






Countries included
- UK
- Ireland
- Poland
- USA
- Netherlands
- Belgium
- France
- Sweden
- Luxembourg
Sectors covered
 Transport
 Charity & public services
 Construction
 Professional Services
 Manufacturing
 Retail & Recruitment
 Technology
 Education
The headlines: Key learnings
Four core trends shaping the engagement landscape in 2026-27, and the emotions driving them.
Communicating change is no longer enough. It’s time to consider if teams actually have the capacity to absorb change, and support its successful implementation.
Trend #2Engagement goes local.Manager behaviours are closely linked to employee emotions. But managers themselves report weaker work-life balance, support and communication.
Trend #3Building trust requires receipts.Employee trust in leadership has dropped, and only visible delivery and follow-through can help to build it back.
Trend #4Back to basics.Purpose, vision and values still matter, but they can’t compensate for poor workplace fundamentals.

First, let’s set the scene by surveying the engagement landscape.
Engagement is holding steady, but the foundations aren’t so stable.
At first glance, it looks like engagement has barely changed since 2023.
A 1% increase in three years speaks to a remarkable stability, but dig a little deeper and you’ll see it’s far more complex than that. Employees may feel motivated and fairly positive about staying put, but several foundational factors have weakened:
A tension emerges…
While leadership, reward and recognition are dropping, employee perception of line managers remains positive. Could it be that managers – by influencing the everyday experience of their direct reports – are propping up engagement?
Happiness is rising, so why isn’t commitment following suit?
Employees are feeling happier, but less emotionally invested. The picture today doesn’t point towards a simple positive or negative shift. Happiness has increased, while stress and irritation have dropped slightly. Yet fewer employees describe themselves as feeling valued, committed, empowered or enthusiastic – the emotions strongly associated with connection, investment in work, and engagement.
So why doesn’t feeling better at work mean feeling more connected to it?
Happiness is the baseline condition that makes the workplace enjoyable, but commitment is the emotional engine that drives performance, resilience and retention.
A transient workplace emotion, which often vanishes when pressure increases or a slightly better offer comes along.
An active, forward-looking emotion, indicating a sense of ownership, and a willingness to exert extra discretionary effort.
Open-text feedback reveals the changing conversation around work.
Inpulse data shows the practical realities of work are playing a bigger part in the employee conversation.
How do these themes show up in employee feedback?
Change & uncertainty: Mostly negative or conflicted. Concern about future direction, restructuring, uncertainty and the cumulative impact of constant change. Employees can remain committed while also feeling apprehensive about what comes next.
Wellbeing & health: Mostly negative or conflicted. Mentions of wellbeing increasingly appear where employees are describing pressure, stress, or other aspects of work affecting how they feel.
Workload & work-life balance: Mostly negative or conflicted. Focus on busy workloads, pressure, stress and difficulty balancing competing demands. Even employees who talk positively about their work describe feeling busy or under pressure.
Progression & development: Sentiment is mixed. Some talk positively about opportunities to learn and progress, while others focus on limited progression, training or development. The theme is more prominent, rather than more negative or positive.
These practical factors increasingly shape how employees describe their daily experience. Organisations must look beyond headline engagement scores, and understand the emotions that drive them.
Averages are hiding the nuance of employee experience.
Overall Engagement Index (EI) masks how employees with different levels of seniority and tenure experience their workplace.

Yet when you look at the data more closely, there are meaningful differences.
Frontline vs. Central teams
Managers vs. Non-managers
Frontline employees feel motivated and are likely to stay, but their wider experience is weaker. Managers are motivated despite having poorer work-life balance, while engagement declines as age increases – falling from 83% among 20-29 year olds to 74% among 30-39 year olds.
Similarly, retention gives organisations a false sense of security.
Although long-tenured employees are considerably less engaged than new starters, their intention to stay remains quite high. But that doesn’t automatically indicate a positive employee experience.
But staying doesn’t always mean thriving.
Retention data forms one part of a bigger, more holistic picture, comprising advocacy, motivation, wellbeing and engagement.

“With the job market being so uncertain and hiring slowing down, staying put is often just the safest move for people, even if they’ve completely checked out or feel stalled in their roles. We call this “job hugging,” and it’s a massive, underdiagnosed risk in most companies right now.
Don’t treat low turnover as a win by itself. Look at your internal mobility data. If people aren’t moving internally and they aren’t leaving the company either, it’s a sign that your talent pool has stagnated.”
The manager squeeze: still motivated, but struggling.
Across the board, managers report poorer conditions than non-managers.
They’re facing several challenges, including a struggle to sustain work-life balance, worsening levels of support, and poorer communication around organisational change, but despite all this, manager motivation remains fairly consistent.
Wider industry data supports this view.
Gallup’s State of the Global Workplace 2026 found that manager engagement fell five points in a single year, from 27% in 2025 to 22% in 2026.
Expectation vs. reality
Organisations are leaning on managers to improve experience at a local level, but are they supporting managers as they adjust to changing responsibilities?
The data suggests more could be done to help managers handle the pressure.
Don’t underestimate sector variance.
When you break it down by sector, there’s a 9pp range in Engagement Index, which is 85% in Education compared to 76% in Charity & Public Services.
But look beyond this headline and you’ll see more stark percentage point gaps across different industries.
Employee emotions also vary considerably between sectors. For instance, 23% of Education employees selected stressed, compared with only 3% in Professional Services.
There are countless invisible factors that contribute to this score. Breadth of responsibility, expectation, support and recognition look vastly different in Education compared to Professional Services, so the pivotal role of sector in shaping experience can’t be overlooked.
Tread carefully with benchmarks…
Two sectors can appear to score similarly in overall engagement, while the emotional experiences behind those scores are nothing alike.
Use sector benchmarks carefully – and if you want to use them, consider zooming in on the employee-experience dimension that’s most relevant to your operating environment.

Change fatigue is growing. Your teams can handle change. The question is, how much?
Communicating change is one thing, but can teams actually absorb it?
Employees continue to perform through change, despite rising exhaustion, frustration, workload and concern about wellbeing.
Making sure change is properly communicated is no longer enough – organisations should consider whether teams actually have the capacity to absorb it, and support its successful implementation.
External research aligns with Inpulse data…
Recent Deloitte research found that 85% of leaders see adaptability as critical – while only 7% are leading adaptation successfully, despite one-third of workers experiencing 15 major changes in the past year. Meanwhile, data from Microsoft reveals a gap between leadership’s expectations and the capacity of their teams, with 53% of leaders stating productivity must increase, while 80% of the workforce reports lack of time or energy to perform.
What can we learn from this?
Focus on creating certainty. Share what’s changing, what’s staying the same, the rationale behind your decisions and what remains unknown.
Translate organisational change into the everyday impact for your team. Keep tabs on how change affects both capacity and employee emotions.
Look at cumulative change across the business – track workload and capacity alongside engagement, and build recovery into transformation plans.

Engagement goes local. Experience drives engagement scores. So what’s shaping experience?
Everyday manager behaviours present the strongest link to engagement.
The clearest pattern to emerge from Inpulse data analysis? Manager behaviours are closely linked to employee emotions.
These are strong associations (not proof of causation), but the pattern is consistent. Support, recognition, communication, trust, wellbeing, feedback – all appear closely connected with stronger engagement.
Engagement Index is consistently higher among employees who positively rated their experience of various manager factors.
This makes the manager squeeze even tighter.
The managers being asked to create the local employee experience are reporting weaker work-life balance, support and communication themselves.
In other words, they’re doing a lot with a little.
What can we learn from this?
Treat manager capability and capacity as a central part of your business’ infrastructure, not an isolated opportunity for HR development.
Prioritise the behaviours that employees experience time and again: support, recognition, feedback, communication and care for wellbeing.
Give your managers relevant team-level insights, the practical capabilities to lead and own engagement, and enough time to lead their people well.
How does Inpulse support manager-led engagement?
Did you know employee engagement doubles under good leadership?
The Inpulse platform is purpose-built to help managers understand how their teams feel – and the emotions driving those feelings.
By putting insight and action directly in the hands of your managers, we help organisations to…
- Tailor engagement improvements to individual teams
- Decentralise engagement as a HR responsibility
- Drive positive outcomes with manager-team conversations
- Respond faster to team-level concerns

Building trust requires receipts. Today’s employees need proof, not another promise.
A little less conversation, a little more action please.
Inpulse data shows that communication alone can’t sustain trust. Leadership has dropped 13pp from 68% to 55%, and less than half believe feedback leads to follow-through.
Trust is directly linked with motivation.
A global 2025 survey from PwC speaks to the strength of that connection. Employees with the highest trust in their direct manager were 72% more motivated than those with the lowest trust.
PwC also found that, while 58% reported trusting their direct manager, and feeling able to speak openly with them, only 50% report top management as being true to their word.
The feedback-action trust loop
- Employees raise an issue in feedback
- Establish how the organisation will respond
- Communicate that response to employees
- Employees can see or feel the difference
- Trust and engagement improves
What can we learn from this?
Close the gap between announcing action and delivering it. Be explicit about your commitments, ownership of actions and progress.
Tell your team how their feedback is being processed, including how you’re planning to follow through, where action can’t be taken and why.
Measure level of confidence in action, as well as whether your employees feel listened to. Make visible follow-through part of your listening strategy.

Back to basics. Purpose still matters – but so do everyday working conditions.
Employee comments reveal a focus on the fundamentals.
Open-text feedback repeatedly returns to the fundamentals of working life.
Purpose, vision and values haven’t stopped mattering, but they can’t compensate for poor work conditions.
How do those fundamental factors look in the UK?
Research from CIPD helps us see these fundamentals through a UK lens. Among employees who said work negatively affected their mental health, 69% named high workload as a driver, while 63% flagged managers as a contributor.
CIPD’s Good Work Index reported improvements in manager approachability regarding mental health and development support. Despite progress, around 10 million UK employees still don’t believe they receive useful feedback, or that their manager helps improve their performance.
Employee emotions are clear: organisations must prioritise improving the fundamentals. You can’t inspire your way out of a workload or pay problem.
What can we learn from this?
Make these fundamentals visible in leadership priorities. Ask whether people have the conditions to do good work before adding more engagement activity.
Focus on practical everyday behaviours: clear priorities, manageable demands, recognition, support, useful feedback and connection.
Use employee listening to identify friction in the basic work experience, including workload, tools, processes, reward and local support.

Joining the dots. What does “good” engagement require in 2026-27?
Engagement has evolved – 73% today doesn’t mean what it did in 2023.
How nearly-identical numbers denote a very different experience.

The headline Engagement Index hasn’t collapsed.
Employees are still productive, feeling committed and relatively positive about staying. But the data shows that maintaining engagement now sits alongside greater exhaustion, frustration, workload pressure, weaker confidence in leadership and reward – and an increased reliance on the role of managers to shape everyday experience.
The conditions that sustain engagement are shifting.
Increasingly, employees seem to judge their organisation by the reality of their everyday working experience. That includes:
- Whether leaders deliver on their word
- If change feels manageable and well-paced
- How managers support and recognise them
- What basic conditions are in place to do the job well
Our conclusion? That maintaining 73% EI in 2026 is likely asking more of employees than 72% was in 2023.
But there’s an opportunity here for organisations to go further than creating more engagement activity – and focus on making the everyday experience of work, work better.
Laying the foundations for good engagement.
Four key pillars point the way.
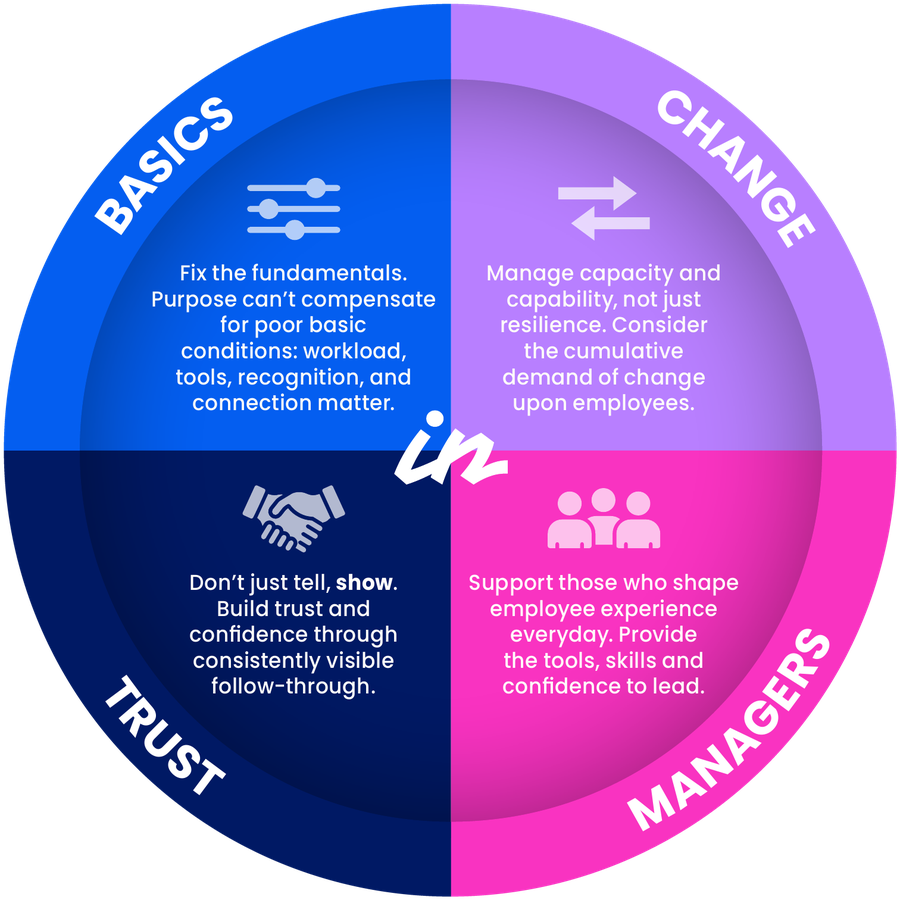
- Basics Fix the fundamentals. Purpose can’t compensate for poor basic conditions: workload, tools, recognition, and connection matter.
- Change Manage capacity and capability, not just resilience. Consider the cumulative demand of change upon employees.
- Trust Don’t just tell, show. Build trust and confidence through consistently visible follow-through.
- Managers Support those who shape employee experience everyday. Provide the tools, skills and confidence to lead.
These pillars are interconnected.
Collectively, they support the foundations of engagement in 2026-27, but also feed into one another.
Change tests trust. Managers translate change into experience at the local level. Their ability to do that depends on how they’re supported – their tools, skills and confidence.
And none of it works well if the fundamentals create constant feelings of friction.
For most organisations, tackling all four pillars at once isn’t realistic. So ask yourself this:
If your employees could choose one area to focus on first, which would it be? And does your current people strategy reflect that?
Chat with an Inpulse expert
Find out how we can help you uncover the emotions driving engagement, turn insights into action, and empower your managers to shape a better everyday experience.
Let’s chat